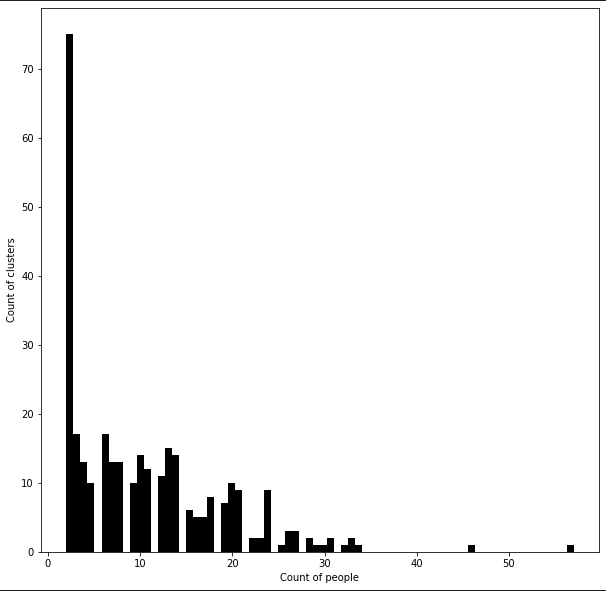
Create histogram from df
df_trace_person_count sample:
| |
trace id |
no of unique person |
| 0 |
TRACE_PERSON_0000000003 |
16 |
| 1 |
TRACE_PERSON_0000000005 |
20 |
| 2 |
TRACE_PERSON_0000000011 |
5 |
| ... |
... |
... |
| 313 |
TRACE_PERSON_0000000995 |
20 |
| 314 |
TRACE_PERSON_0000000998 |
6 |
| 315 |
TRACE_PERSON_0000000999 |
8 |
Code:
import matplotlib.pyplot as plt

fig = plt.figure(figsize=(10,10))
axes1 = fig.add_subplot(1,1,1)
axes1.hist(df_trace_person_count['no of unique person'],bins=72, color='black')
axes1.set_xlabel('Count of people')
axes1.set_ylabel('Count of clusters')
Result: